What is the population of United States in 2020?
According to statistics from the U.S. Census Bureau, the U.S. population is reaching 331,449,281 in 2020, which is 308,745,538 higher than the 2010 census, with a growth rate of 7.4%. Compared with the previous decade, the population growth rate has slowed down. Here is a list of the 2020 census population and representatives of each state, you can click the title to browse the detailed information.
| State | Estimate Population 2021 | Census Population 2020 | Comp | Comp(%) | Rank 2021 | Rank 2020 | Representatives seats | Percent of total U.S.(%, 2020) |
|---|---|---|---|---|---|---|---|---|
| Alabama | 5,039,877 | 5,024,279 | +15,598 | 0.31 | 24 | 24 | 7 | 1.50 |
| Alaska | 732,673 | 733,391 | -718 | -0.10 | 49 | 49 | 1 | 0.22 |
| Arizona | 7,276,316 | 7,151,502 | +124,814 | 1.75 | 14 | 14 | 9 | 2.13 |
| Arkansas | 3,025,891 | 3,011,524 | +14,367 | 0.48 | 34 | 34 | 4 | 0.90 |
| California | 39,237,836 | 39,538,223 | -300,387 | -0.76 | 1 | 1 | 52 | 11.80 |
| Colorado | 5,812,069 | 5,773,714 | 38,355 | 0.66 | 21 | 21 | 8 | 1.72 |
| Connecticut | 3,605,597 | 3,605,944 | -347 | -0.01 | 29 | 29 | 5 | 1.08 |
| Delaware | 1,003,384 | 989,948 | 134,36 | 1.36 | 46 | 46 | 1 | 0.30 |
| District of Columbia | 670,050 | 689,545 | -19,495 | -2.83 | 50 | 50 | 1(non-voting) | 0.21 |
| Florida | 21,781,128 | 21,538,187 | 242,941 | 1.13 | 3 | 3 | 28 | 6.43 |
| Georgia | 10,799,566 | 10,711,908 | 87,658 | 0.82 | 8 | 8 | 14 | 3.20 |
| Hawaii | 1,441,553 | 1,455,271 | -13,718 | -0.94 | 41 | 41 | 2 | 0.43 |
| Idaho | 1,900,923 | 1,839,106 | 61,817 | 3.36 | 39 | 39 | 2 | 0.55 |
| Illinois | 12,671,469 | 12,812,508 | -141,039 | -1.10 | 6 | 6 | 17 | 3.82 |
| Indiana | 6,805,985 | 6,785,528 | 20,457 | 0.30 | 17 | 17 | 9 | 2.03 |
| Iowa | 3,193,079 | 3,190,369 | 2,710 | 0.08 | 32 | 32 | 4 | 0.95 |
| Kansas | 2,934,582 | 2,937,880 | -3,298 | -0.11 | 36 | 36 | 4 | 0.88 |
| Kentucky | 4,509,394 | 4,505,836 | 3,558 | 0.08 | 26 | 26 | 6 | 1.34 |
| Louisiana | 4,624,047 | 4,657,757 | -33,710 | -0.72 | 25 | 25 | 6 | 1.39 |
| Maine | 1,372,247 | 1,362,359 | 9,888 | 0.73 | 43 | 43 | 2 | 0.41 |
| Maryland | 6,165,129 | 6,177,224 | -12,095 | -0.20 | 19 | 18 | 8 | 1.84 |
| Massachusetts | 6,984,723 | 7,029,917 | -45,194 | -0.64 | 15 | 15 | 9 | 2.10 |
| Michigan | 10,050,811 | 10,077,331 | -26,520 | -0.26 | 10 | 10 | 13 | 3.01 |
| Minnesota | 5,707,390 | 5,706,494 | 896 | 0.02 | 22 | 22 | 8 | 1.70 |
| Mississippi | 2,949,965 | 2,961,279 | -11,314 | -0.38 | 35 | 35 | 4 | 0.88 |
| Missouri | 6,168,187 | 6,154,913 | 13,274 | 0.22 | 18 | 19 | 8 | 1.84 |
| Montana | 1,104,271 | 1,084,225 | 20,046 | 1.85 | 44 | 45 | 2 | 0.32 |
| Nebraska | 1,963,692 | 1,961,504 | 2,188 | 0.11 | 38 | 38 | 3 | 0.59 |
| Nevada | 3,143,991 | 3,104,614 | 39,377 | 1.27 | 33 | 33 | 4 | 0.93 |
| New Hampshire | 1,388,992 | 1,377,529 | 11,463 | 0.83 | 42 | 42 | 2 | 0.41 |
| New Jersey | 9,267,130 | 9,288,994 | -21,864 | -0.24 | 11 | 11 | 12 | 2.77 |
| New Mexico | 2,115,877 | 2,117,522 | -1,645 | -0.08 | 37 | 37 | 3 | 0.63 |
| New York | 19,835,913 | 20,201,249 | -365,336 | -1.81 | 4 | 4 | 26 | 6.03 |
| North Carolina | 10,551,162 | 10,439,388 | 111,774 | 1.07 | 9 | 9 | 14 | 3.12 |
| North Dakota | 774,948 | 779,094 | -4,146 | -0.53 | 48 | 48 | 1 | 0.23 |
| Ohio | 11,780,017 | 11,799,448 | -19,431 | -0.16 | 7 | 7 | 15 | 3.52 |
| Oklahoma | 3,986,639 | 3,959,353 | 27,286 | 0.69 | 28 | 28 | 5 | 1.18 |
| Oregon | 4,246,155 | 4,237,256 | 8,899 | 0.21 | 27 | 27 | 6 | 1.26 |
| Pennsylvania | 12,964,056 | 13,002,700 | -38,644 | -0.30 | 5 | 5 | 17 | 3.88 |
| Rhode Island | 1,095,610 | 1,097,379 | -1,769 | -0.16 | 45 | 44 | 2 | 0.33 |
| South Carolina | 5,190,705 | 5,118,425 | 72,280 | 1.41 | 23 | 23 | 7 | 1.53 |
| South Dakota | 895,376 | 886,667 | 8,709 | 0.98 | 47 | 47 | 1 | 0.26 |
| Tennessee | 6,975,218 | 6,910,840 | 64,378 | 0.93 | 16 | 16 | 9 | 2.06 |
| Texas | 29,527,941 | 29,145,505 | 382,436 | 1.31 | 2 | 2 | 38 | 8.70 |
| Utah | 3,337,975 | 3,271,616 | 66,359 | 2.03 | 30 | 31 | 4 | 0.98 |
| Vermont | 645,570 | 643,077 | 2493 | 0.39 | 51 | 51 | 1 | 0.19 |
| Virginia | 8,642,274 | 8,631,393 | 10,881 | 0.13 | 12 | 12 | 11 | 2.58 |
| Washington | 7,738,692 | 7,705,281 | 33,411 | 0.43 | 13 | 13 | 10 | 2.30 |
| West Virginia | 1,782,959 | 1,793,716 | -10,757 | -0.60 | 40 | 40 | 2 | 0.54 |
| Wisconsin | 5,895,908 | 5,893,718 | 2,190 | 0.04 | 20 | 20 | 8 | 1.76 |
| Wyoming | 578,803 | 576,851 | 1,952 | 0.34 | 52 | 52 | 1 | 0.17 |
| Puerto Rico | 3,263,584 | 3,285,874 | -22,290 | -0.68 | 31 | 30 | 1(non-voting) | 0.98 |
| American Samoa | - | 49,710 | - | - | - | 55 | 1(non-voting) | 0.01 |
| Guam | - | 153,836 | - | - | - | 53 | 1(non-voting) | 0.05 |
| U.S. Virgin Islands | - | 87,146 | - | - | - | 54 | 1(non-voting) | 0.03 |
| Northern Mariana Islands | - | 47,329 | - | - | - | 56 | 1(non-voting) | 0.01 |
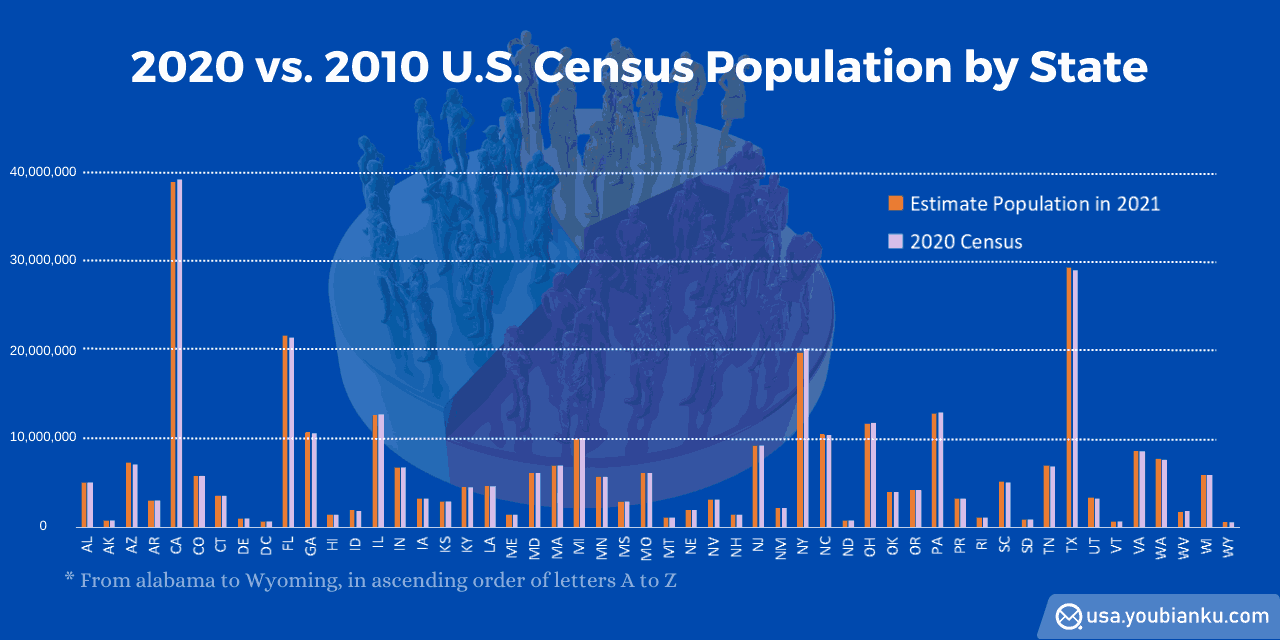
U.S. Population Comparison of 2020 and 2021
There were some changes in population between 2020 and 2021. For example, the five most populous states in 2020 were California, Texas, Florida, New York, and Pennsylvania, with populations of 39.3 million, 29.1 million, 21.5 million, 19.3 million, and 13 million, respectively. However, the order of these states may have changed slightly in 2021, and there may have been population increases or decreases in some of these states and others as well.
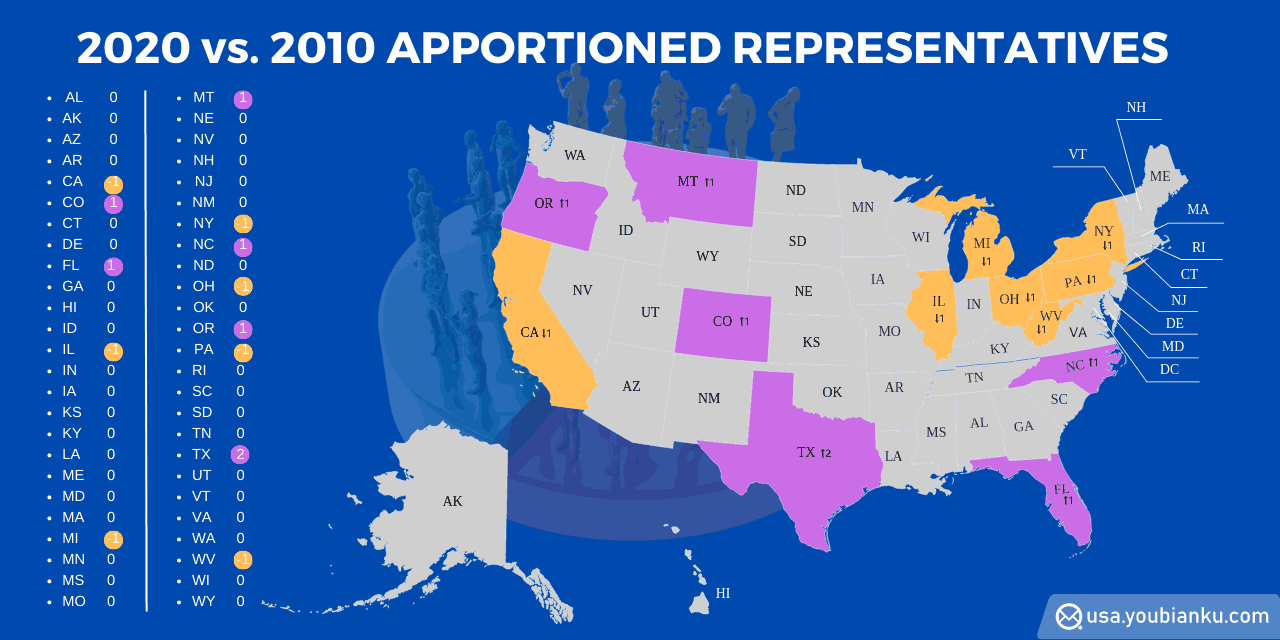
U.S. Apportioned Representatives Change
In 2020, Colorado, Florida, Montana, North Carolina, and Oregon each gained one seat, while Texas gained two seats. Meanwhile, California, Illinois, Michigan, New York, Ohio, Pennsylvania, and West Virginia each lost one seat compared to their representation in 2010. The total seats of all states remain at 435.


Add new comment